Back to top

Dashboards

This page lists some available dashboards for viewing reported information through the Georgia Environmental Finance Authority. Click a dashboard link below to see a focused view of data:

Water/Sewer Dashboards
screenshot of utility-focus data sheet

Utility Focus: View a display of key identifiers, statistics, and rate information for a selected utility.

screenshot of single-utility data sheet

Single Utility Comparison: Compare a selected utility’s metrics to the range of utilities in its planning region and statewide

screenshot of single-utility data sheet


Expanded Comparison: Compare a primary selection of filter options to a separate comparison group

  • Primary Selection: Used to display summary statistics and calculate the key performance measures on each comparison bar. These values will be impacted by the Service, Volume, and Percent Increase bar sliders displays. If more than one Utility is selected the average value for all utilities included within the primary selection filters will be displayed
     
  • Comparison Group: Selections from these filters, or charts, will be used to calculate the ranges of the comparison gauges and bar charts. Several selections can be made in the comparison filter bar and tracked via the Qlik Selection Bar at the top of the app. Connections and MHHI dimension selections can only be made by selecting the desired comparison range on the bar charts’ horizontal axes. Once the range is started by clicking and dragon on the axis values, these can be typed manually into the feature boxes for greater flexibility.
Stormwater Dashboards
screenshot of single-utility data sheet

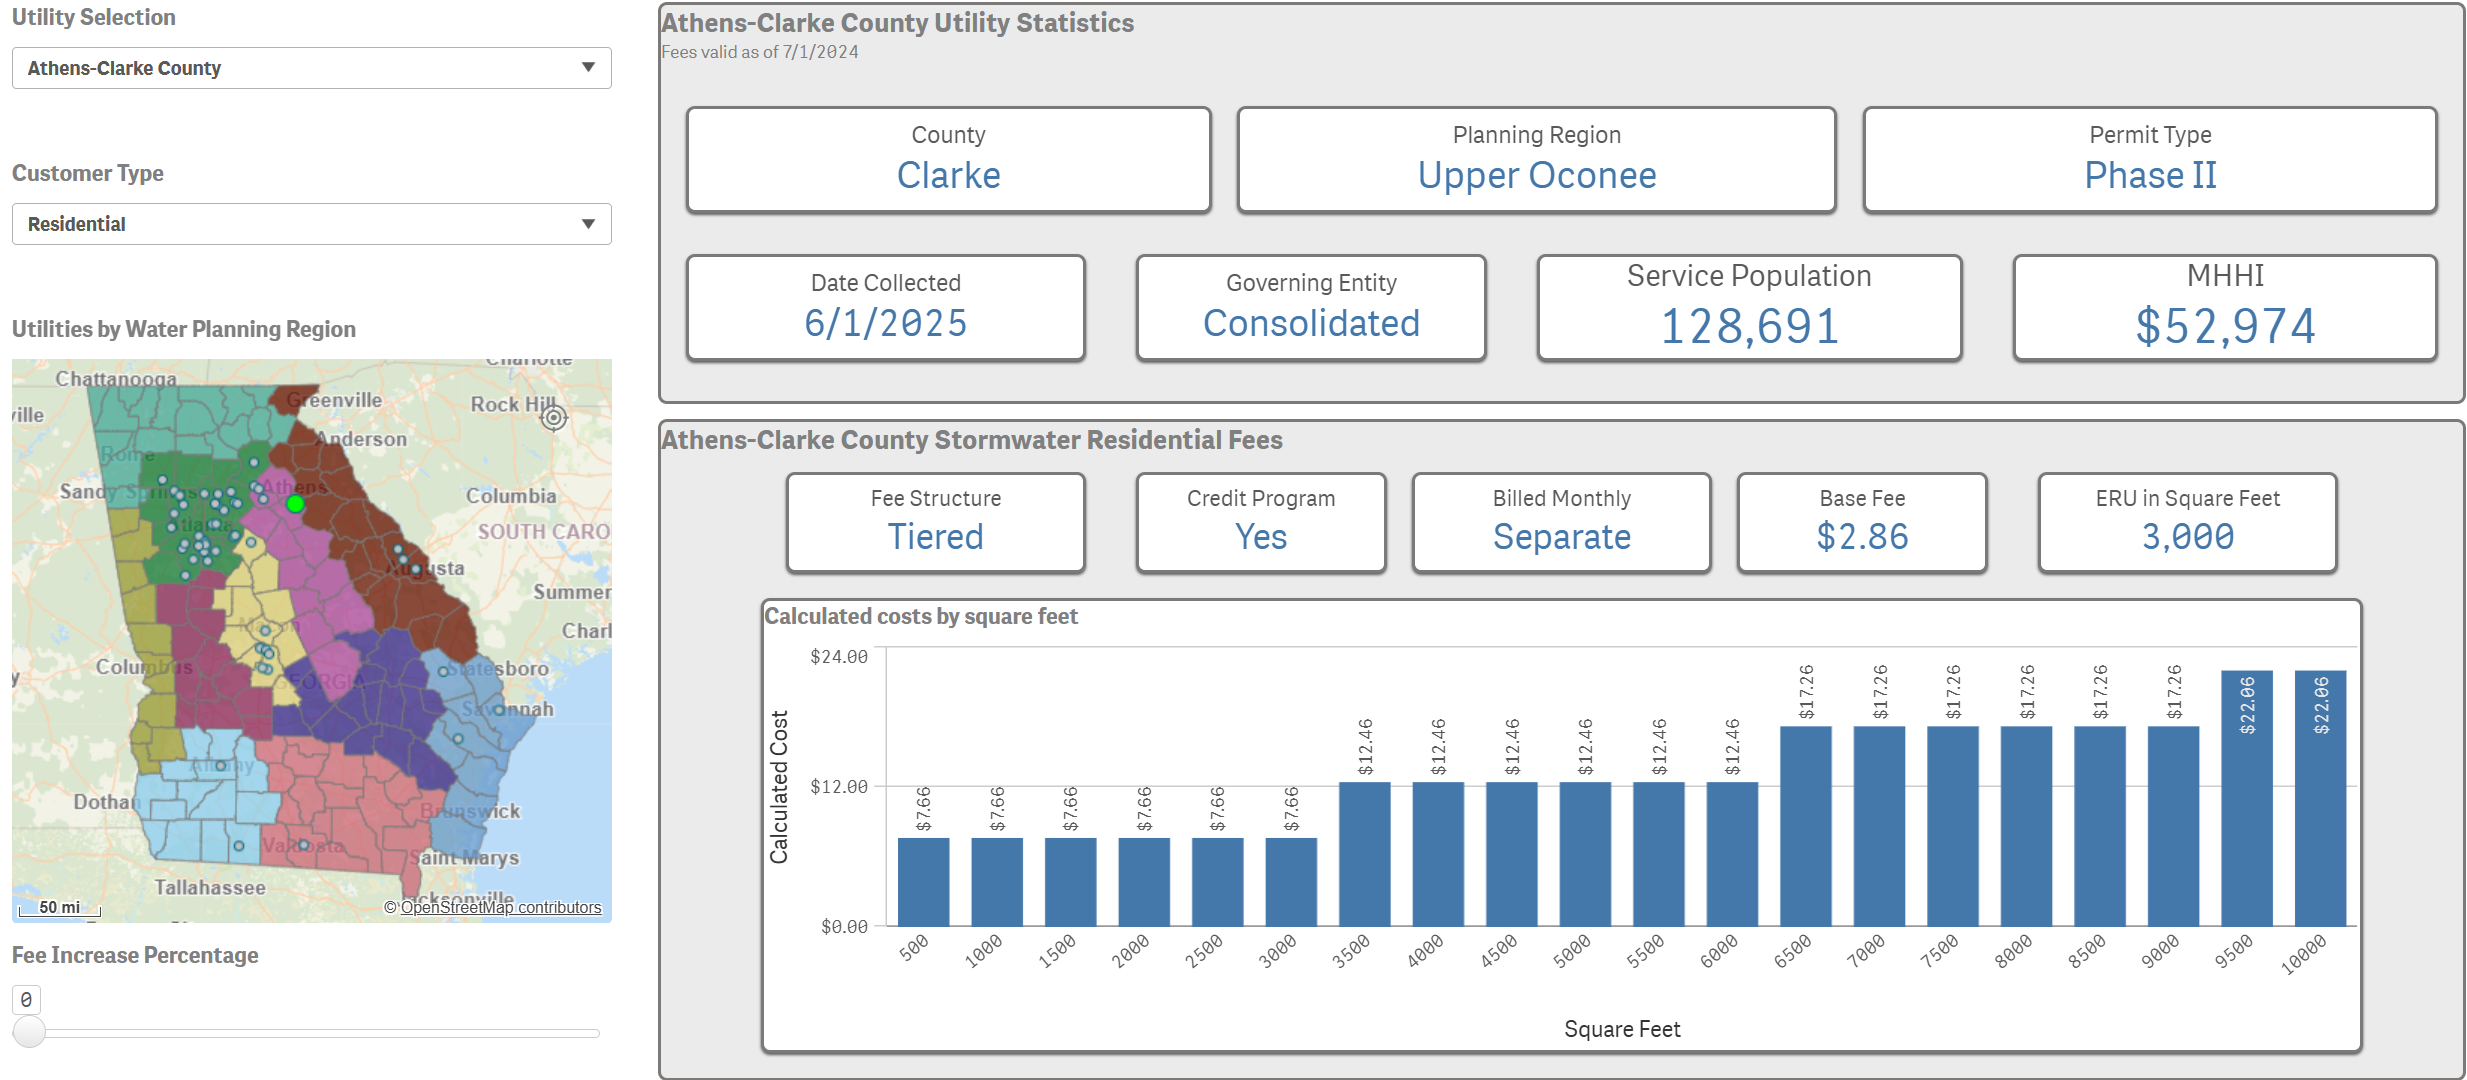
Stormwater Utility Overview by Sq ft: View a display of key identifiers, statistics, and fee information for a selected utility that uses square feet measurements.

screenshot of utility-focus data sheet

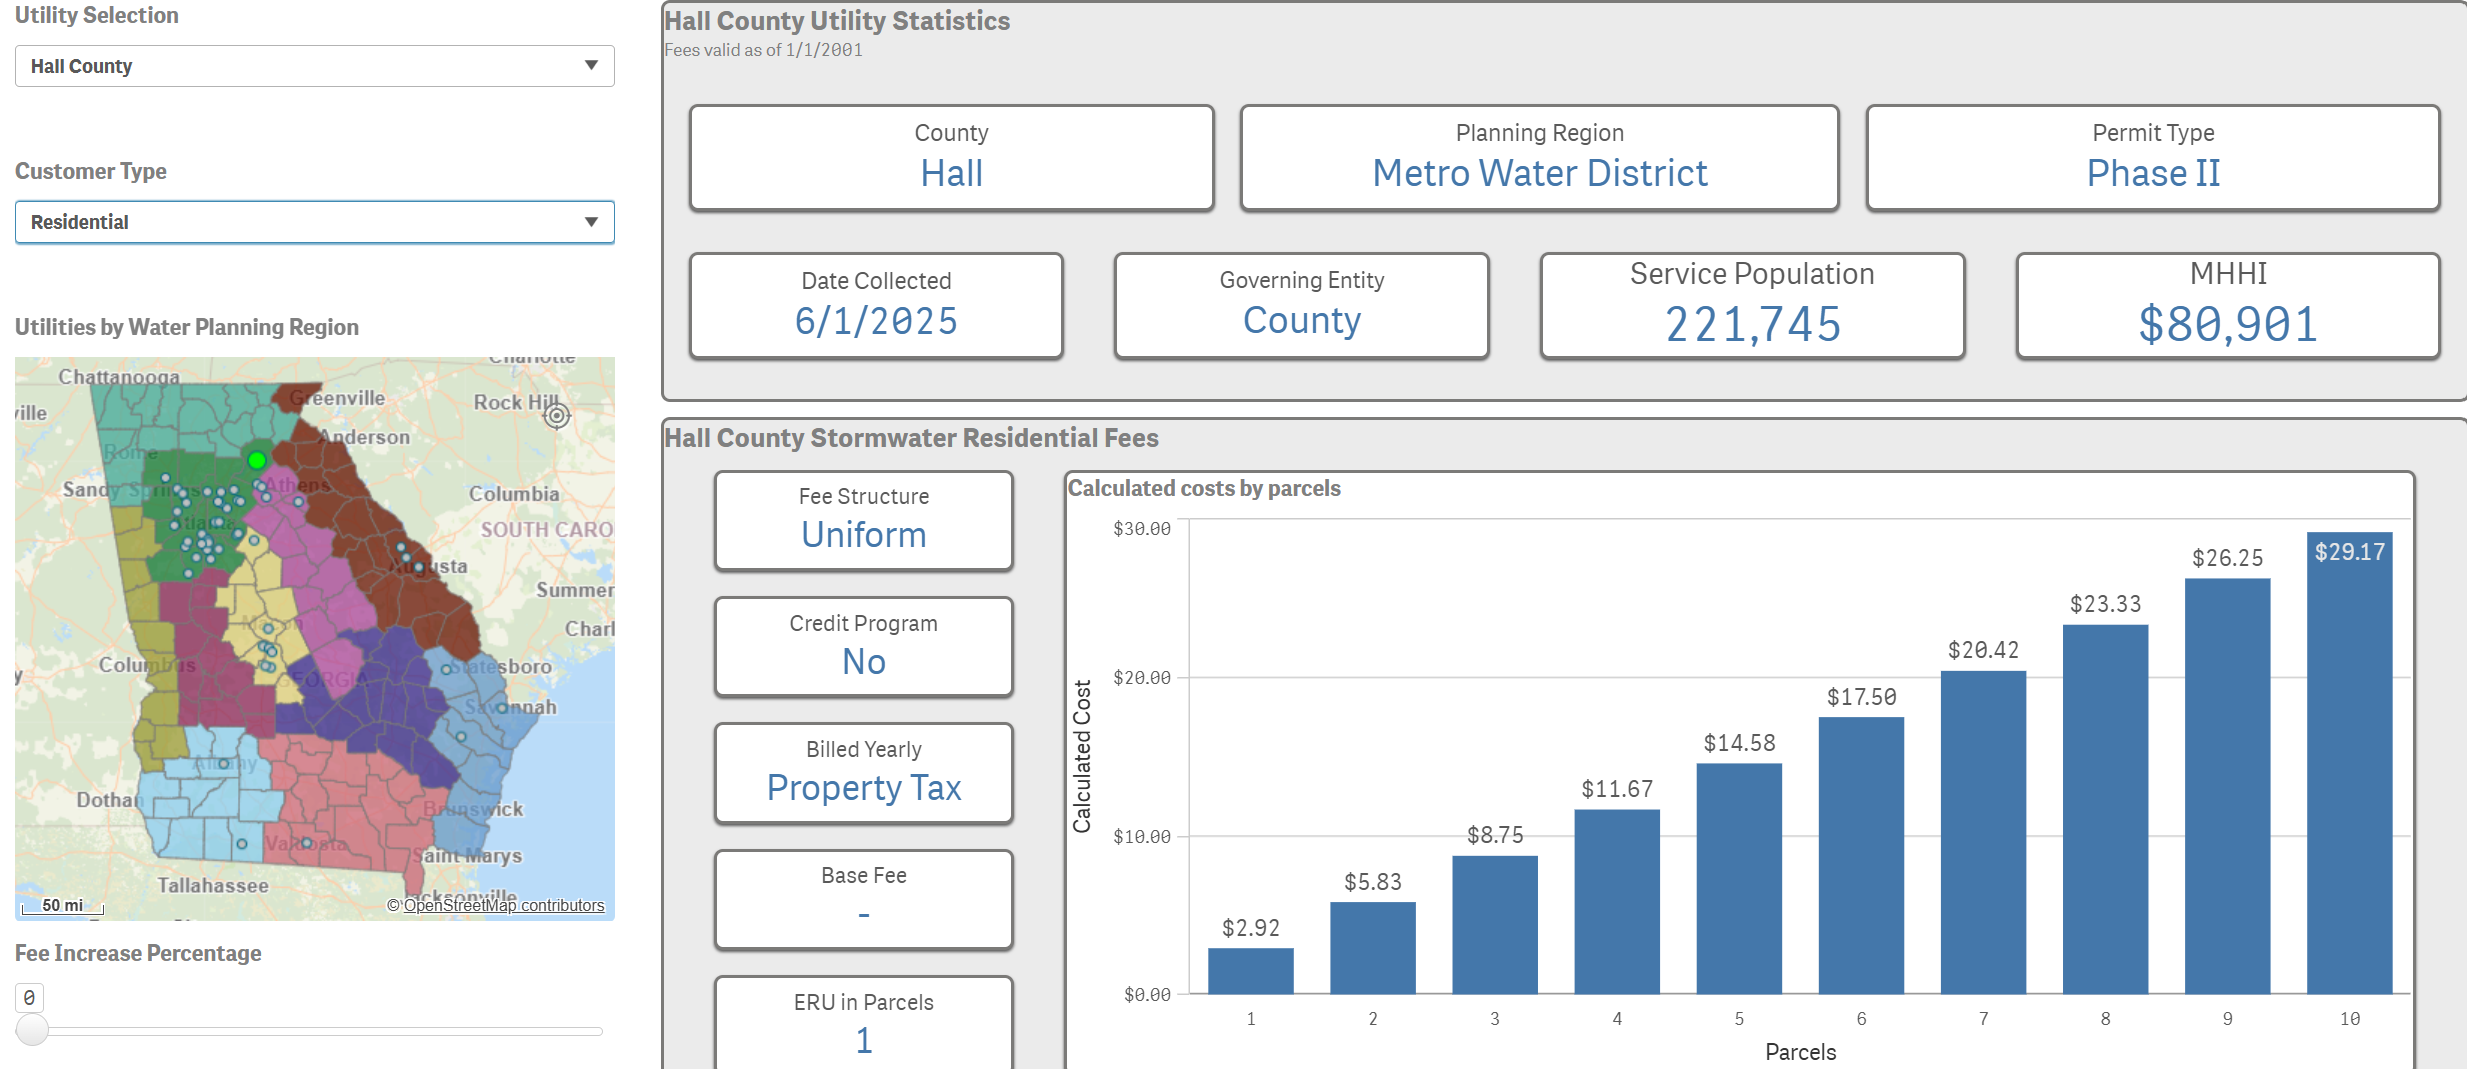
Stormwater Utility Overview By Parcels: View a display of key identifiers, statistics, and fee information for a selected utility that uses parcel measurements.

screenshot of single-utility data sheet

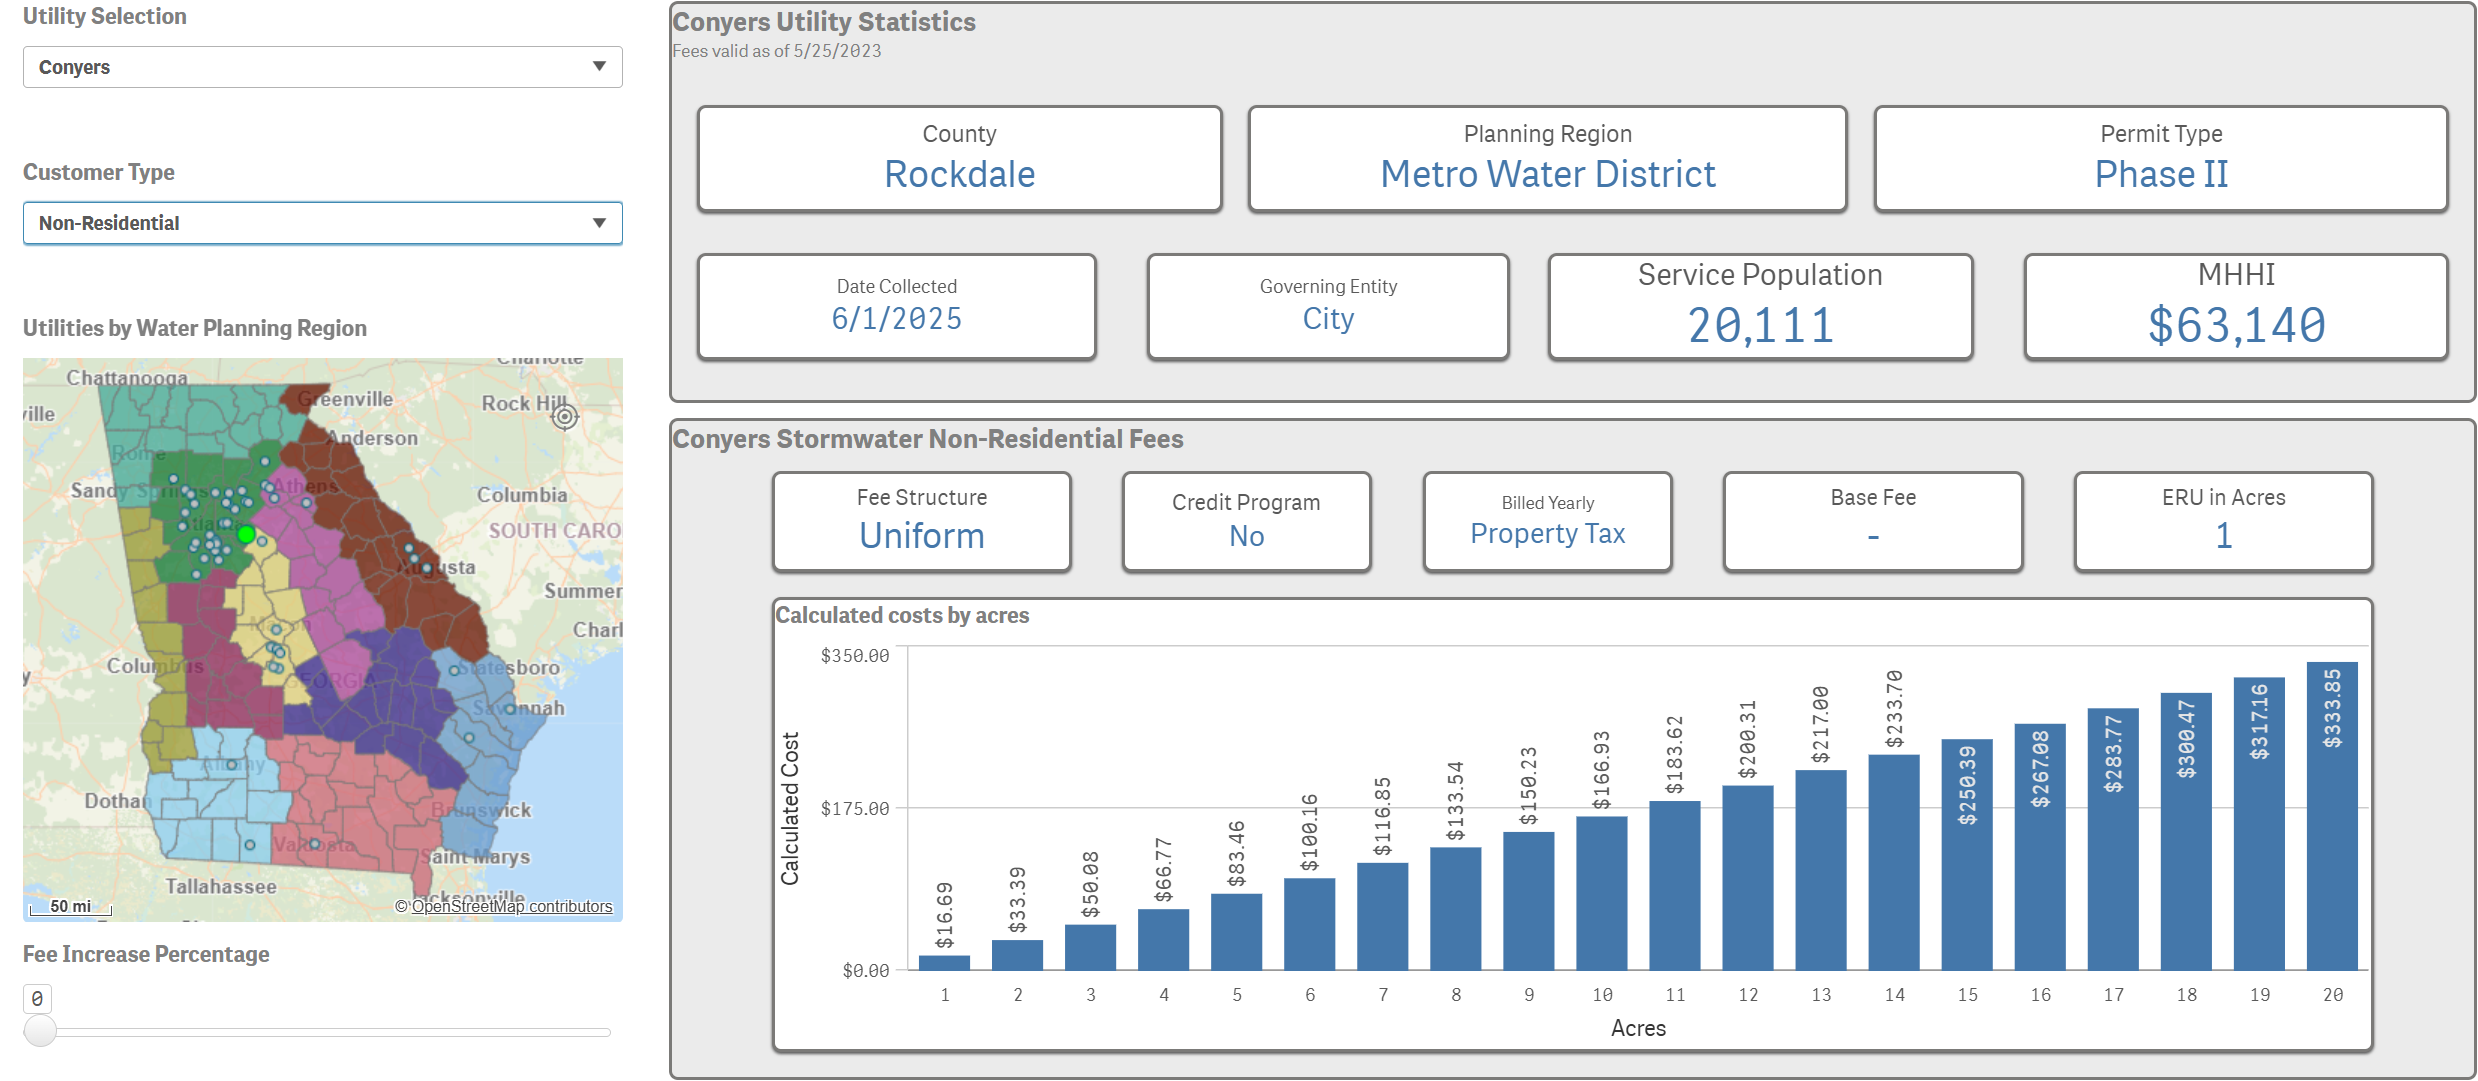
Stormwater Utility Overview by Acres: View a display of key identifiers, statistics, and fee information for a selected utility that uses acre measurements.

screenshot of utility-focus data sheet

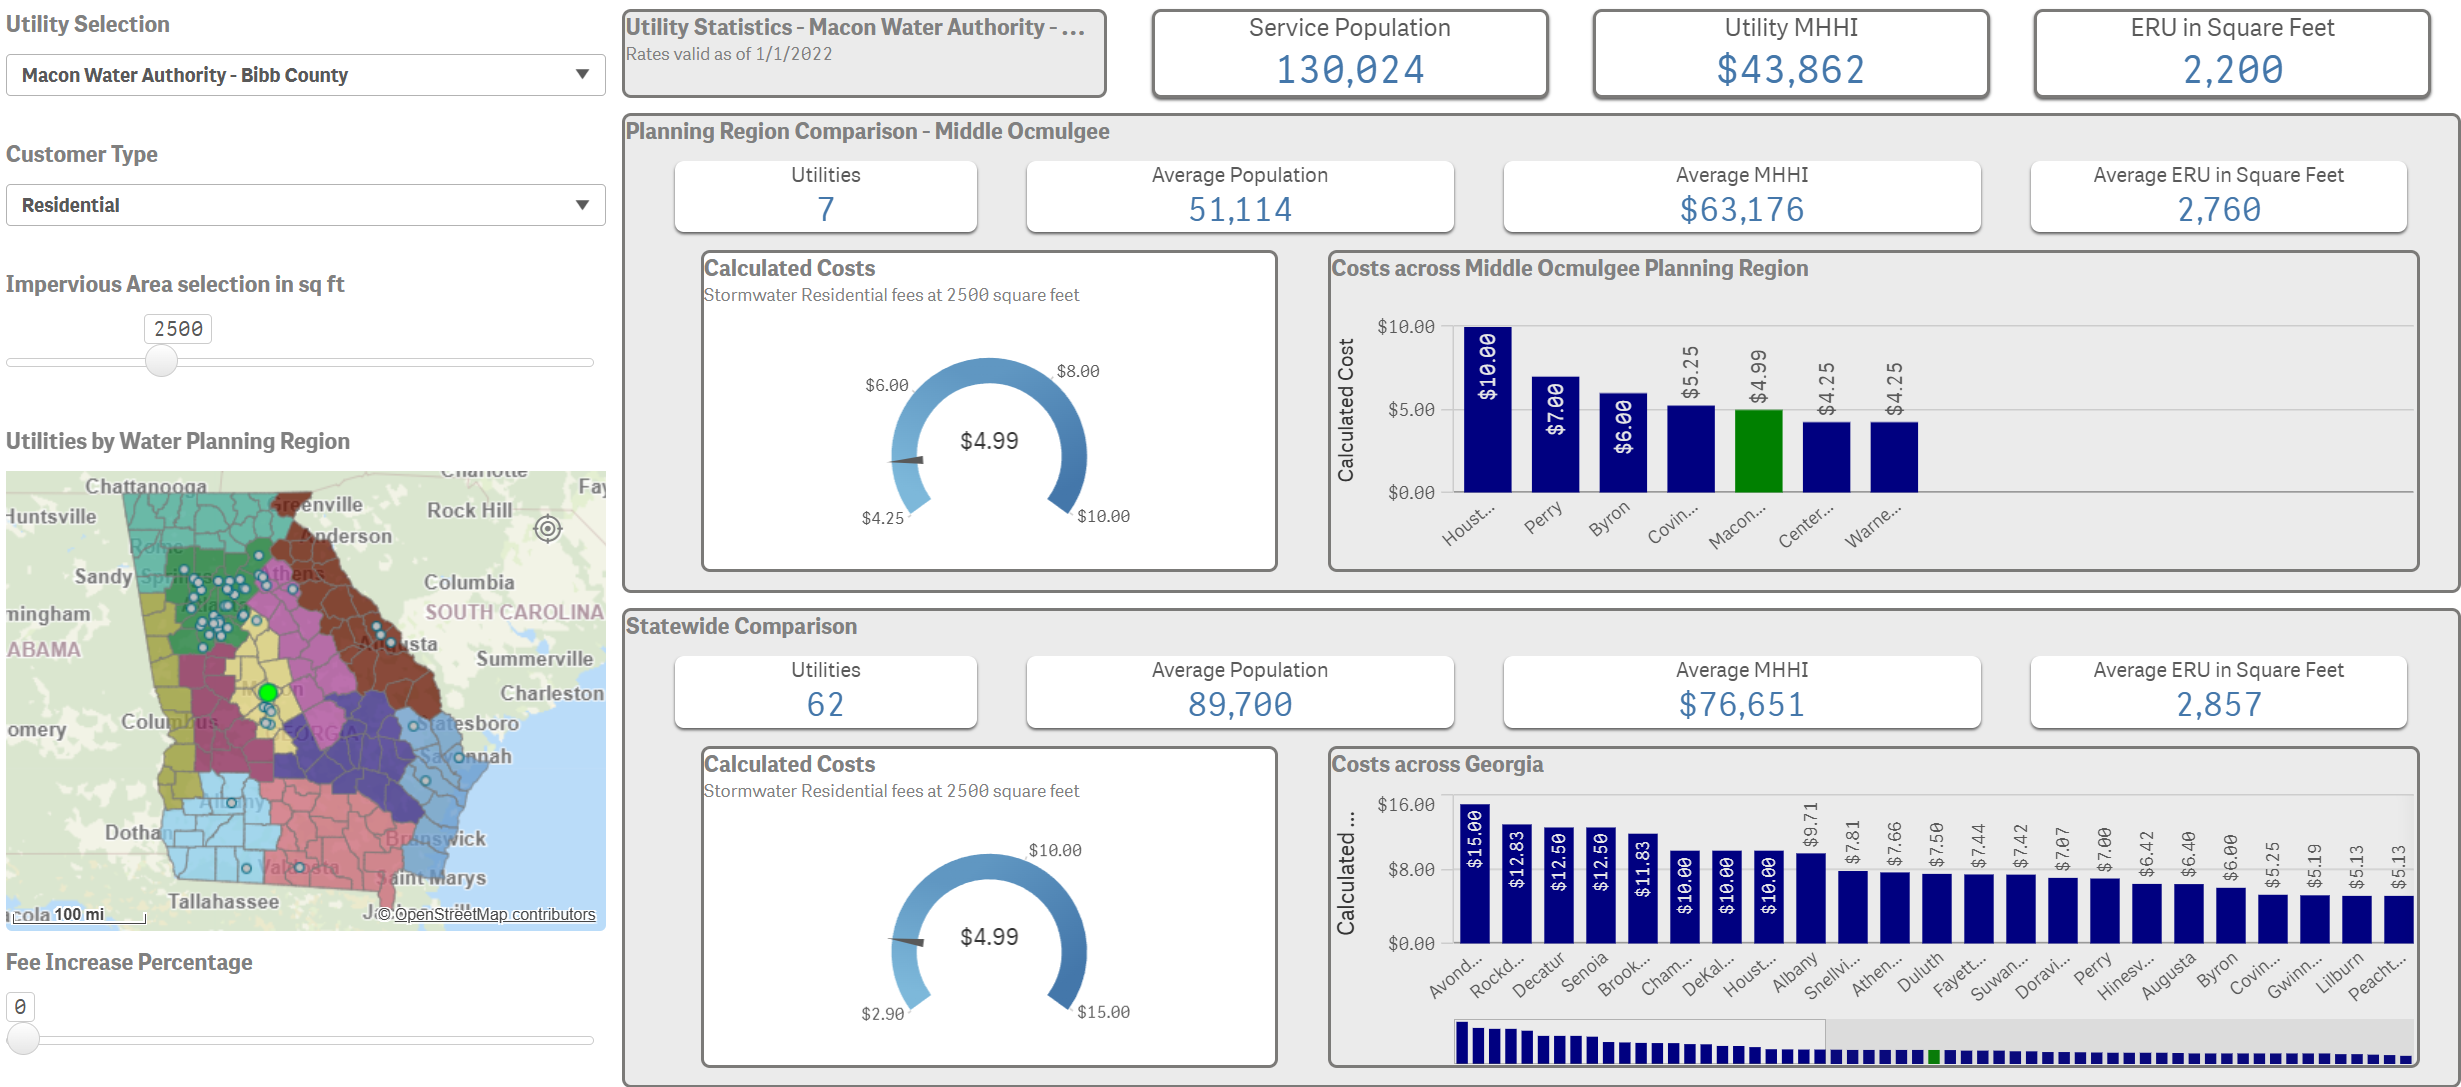
Stormwater Utility Costs (Sq ft): Compare a selected utility’s metrics to the range of utilities in its planning region and statewide.

screenshot of stormwater data tables sheet

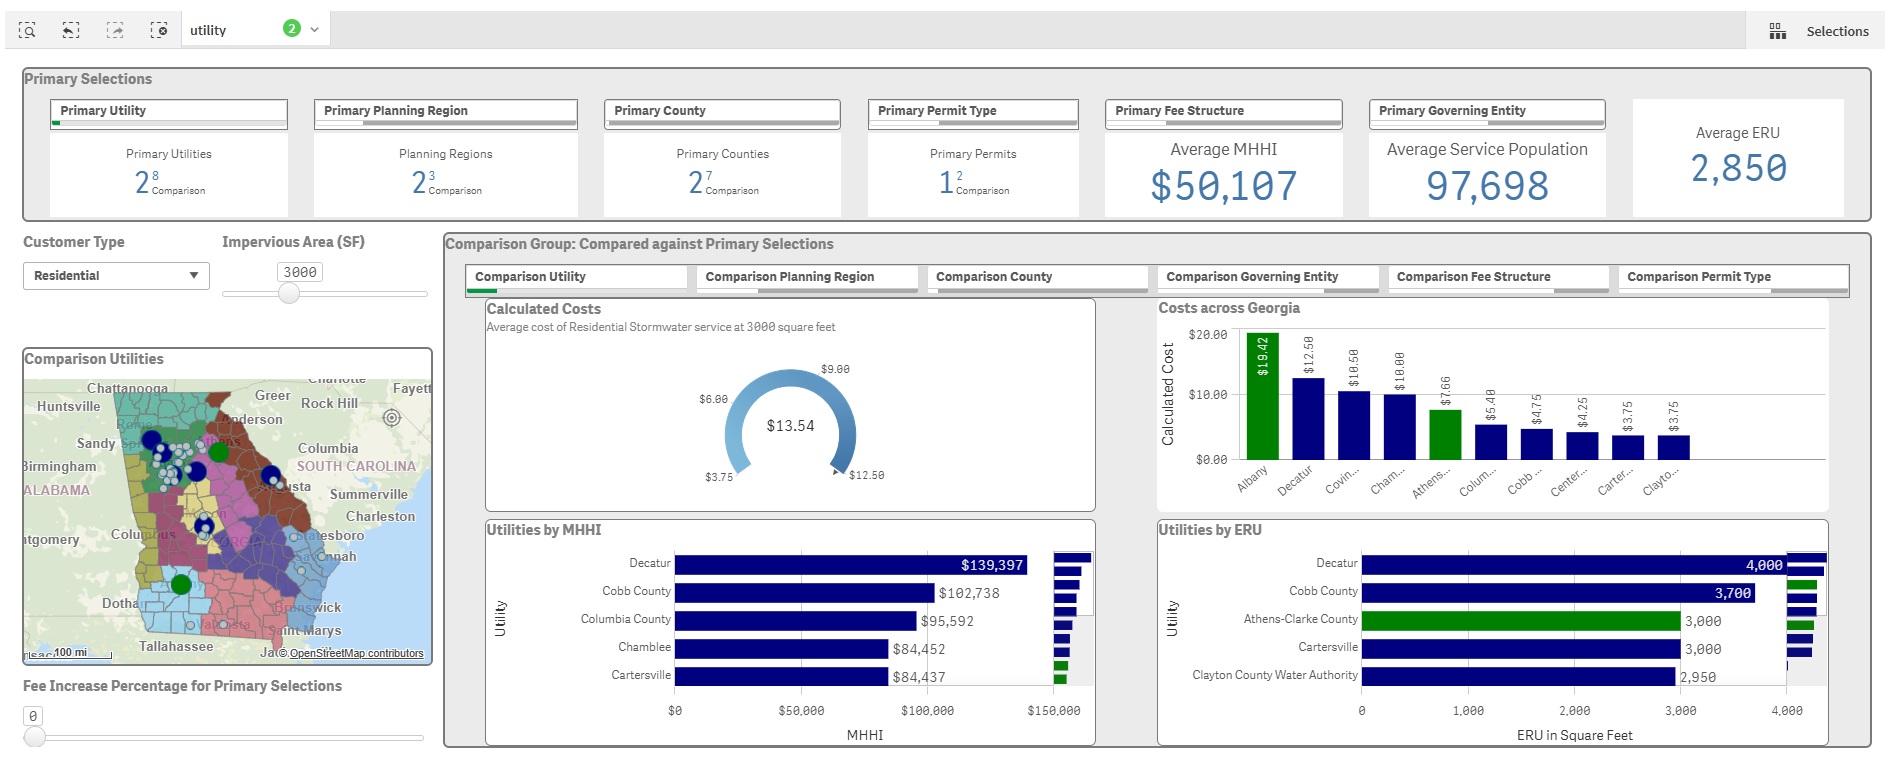
Stormwater Expanded Comparison (Sq ft): Compare a primary selection of filter options to a separate comparison group.

  • Primary Selection: Used to display summary statistics and calculate the key performance measures on each comparison bar. If more than one Utility is selected, the average value for all utilities included within the primary selection filters will be displayed.
  • Comparison Group: Selections from these filters, or charts, will be used to calculate the ranges of the comparison gauges and bar charts. Several selections can be made in the comparison filter bar and tracked via the Qlik Selection Bar at the top of the app. Costs, MHHI, and ERU dimension selections can only be made by selecting the desired comparison range on the bar charts’ horizontal axes. Once the range is started by clicking and dragging the axis values, these can be typed manually into the feature boxes for greater flexibility.
screenshot of stormwater data tables sheet

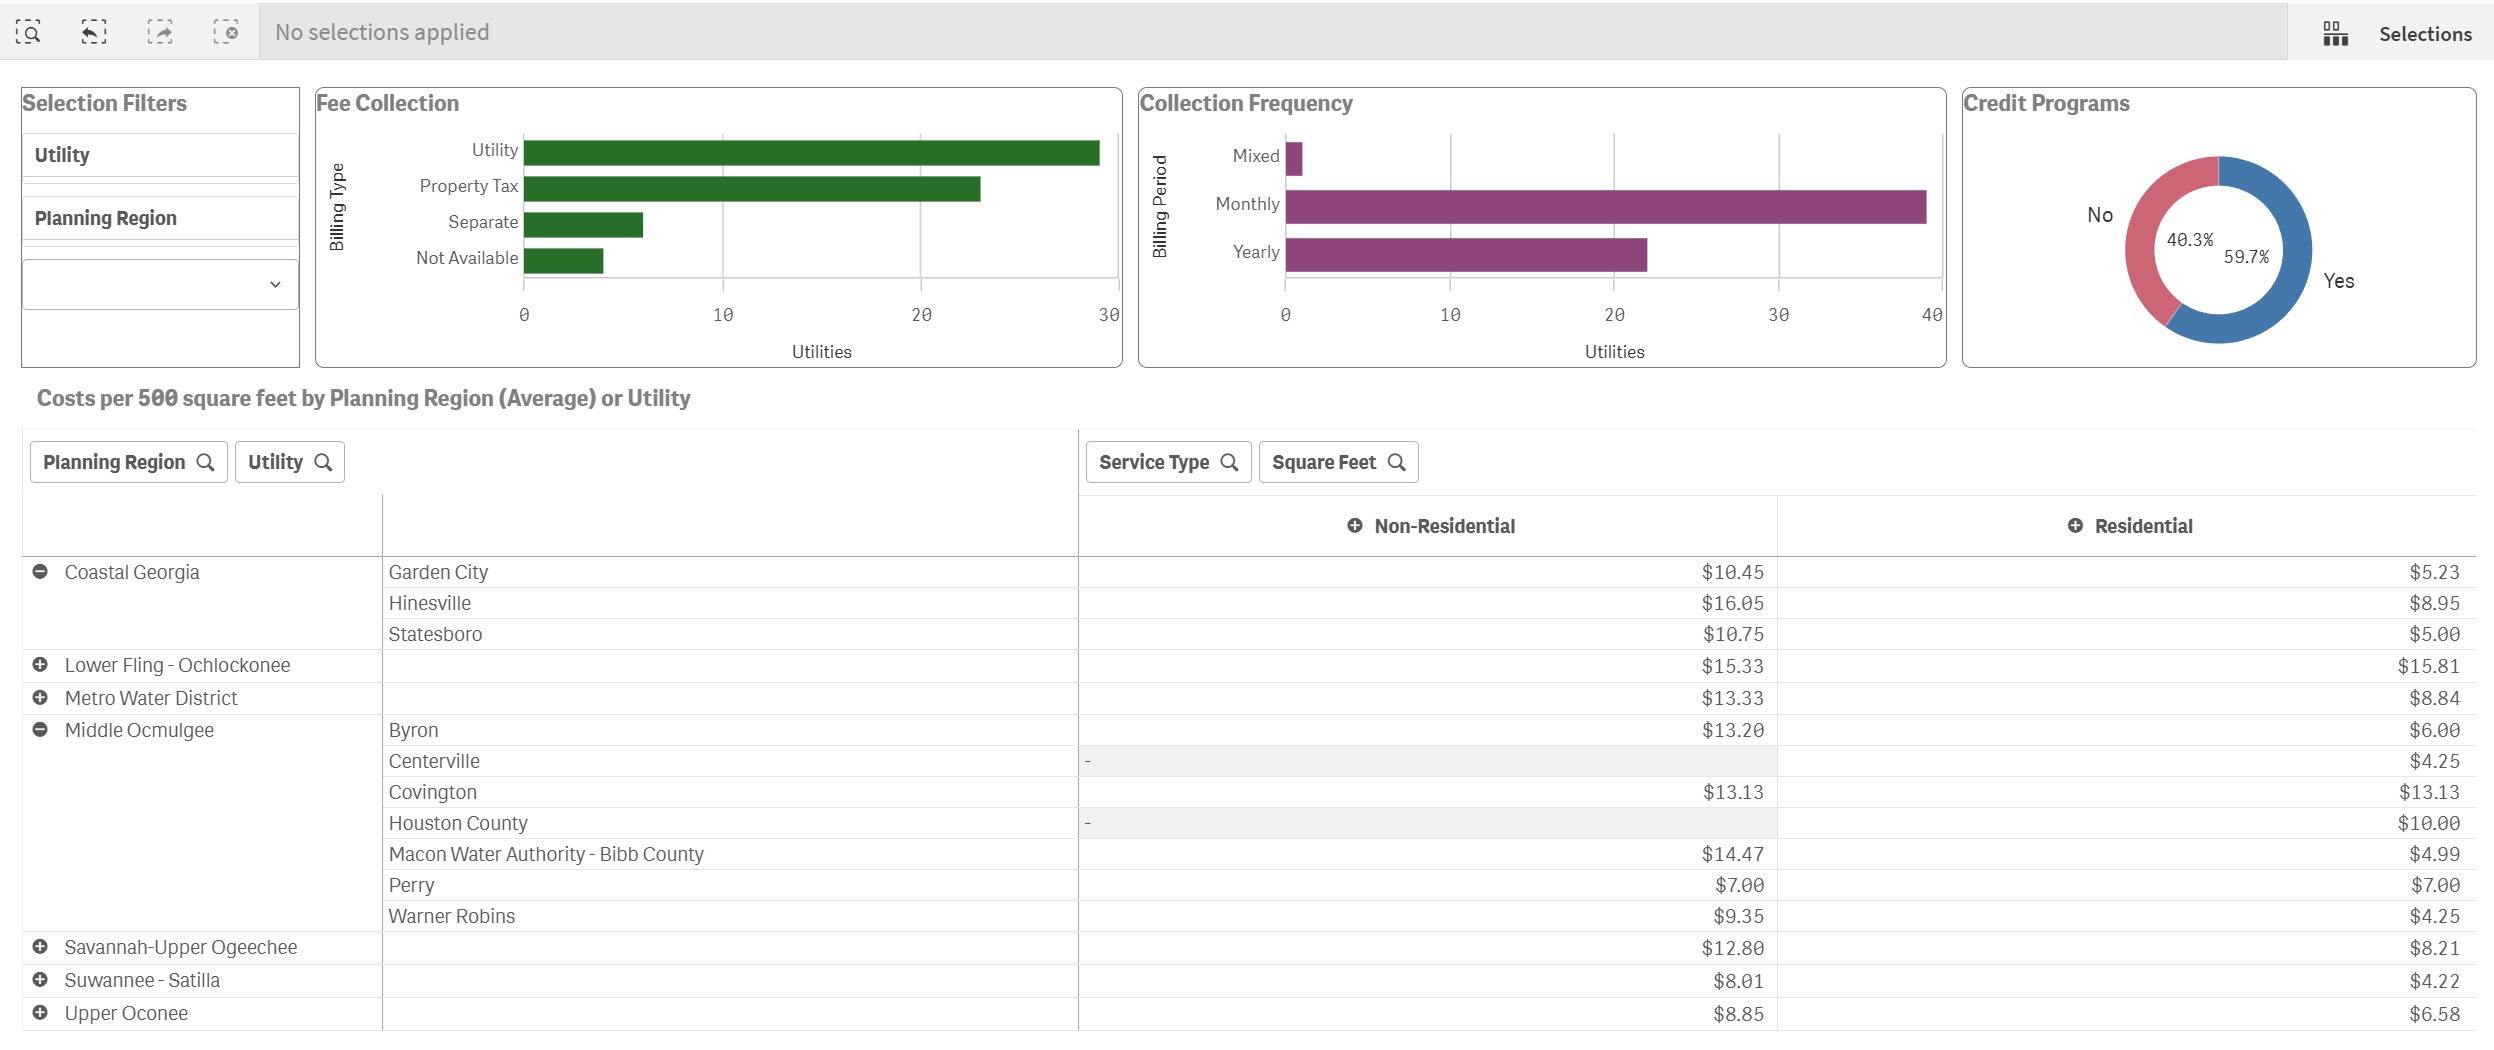
Stormwater Data Tables: View fee information for utilities using square feet in table format and charts for bill type, bill frequency, and existence of credit programs. Additional information about credit programs can be found within the specific utility rate report.
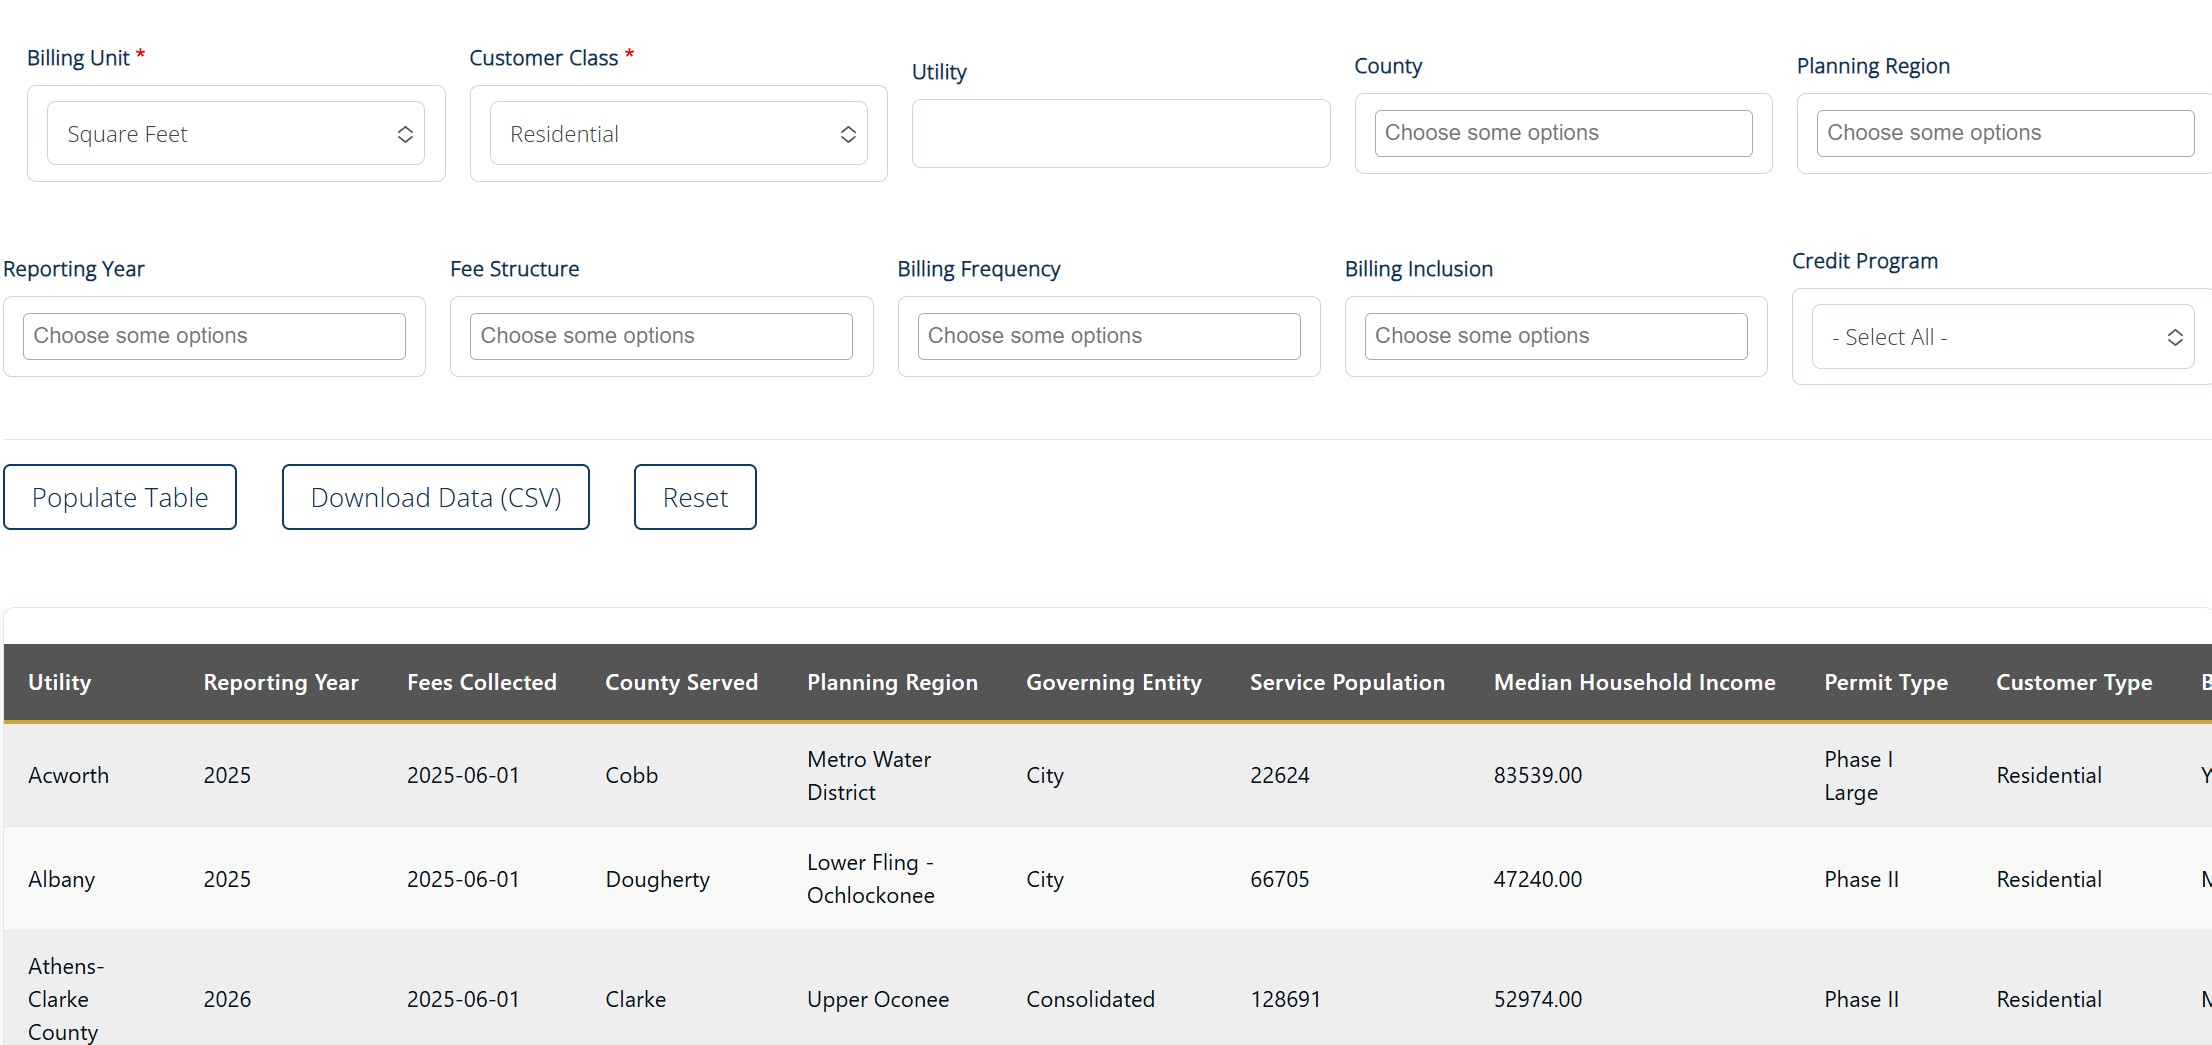